Despite the fact that the history of project management as a distinct discipline spans almost 70 years, there is still no consensus on how to assess project success. Discussions and even scientific researches on this topic take place regularly, resulting in several competing approaches — from ROI analysis to the stakeholder surveys. After all, the projects can vary in their goals, scope and implementation context — from the IT sector to construction or social initiatives.
We previously discussed how a project may be destined for failure if the project team does not understand its goals and lacks the ability to assess its own work. Therefore, in this series of articles, we will attempt to present several ways to assess various aspects of the projects and identify the ‘red flags’ timely. We are talking about early warning signs and alerts that the venture will not be successful or that the project is moving in the wrong direction. While this may not save young professionals from failure, it will at least save them a lot of stress in practice.
The number of metrics that the Project Managers track can run into dozens. It is impossible to say definitively which of them are the most important, and on which it makes no sense or is even harmful to spend limited time. Therefore, we will discuss the most well-known and popular ones. Let’s start with the ‘iron triangle’.
What is the iron triangle?
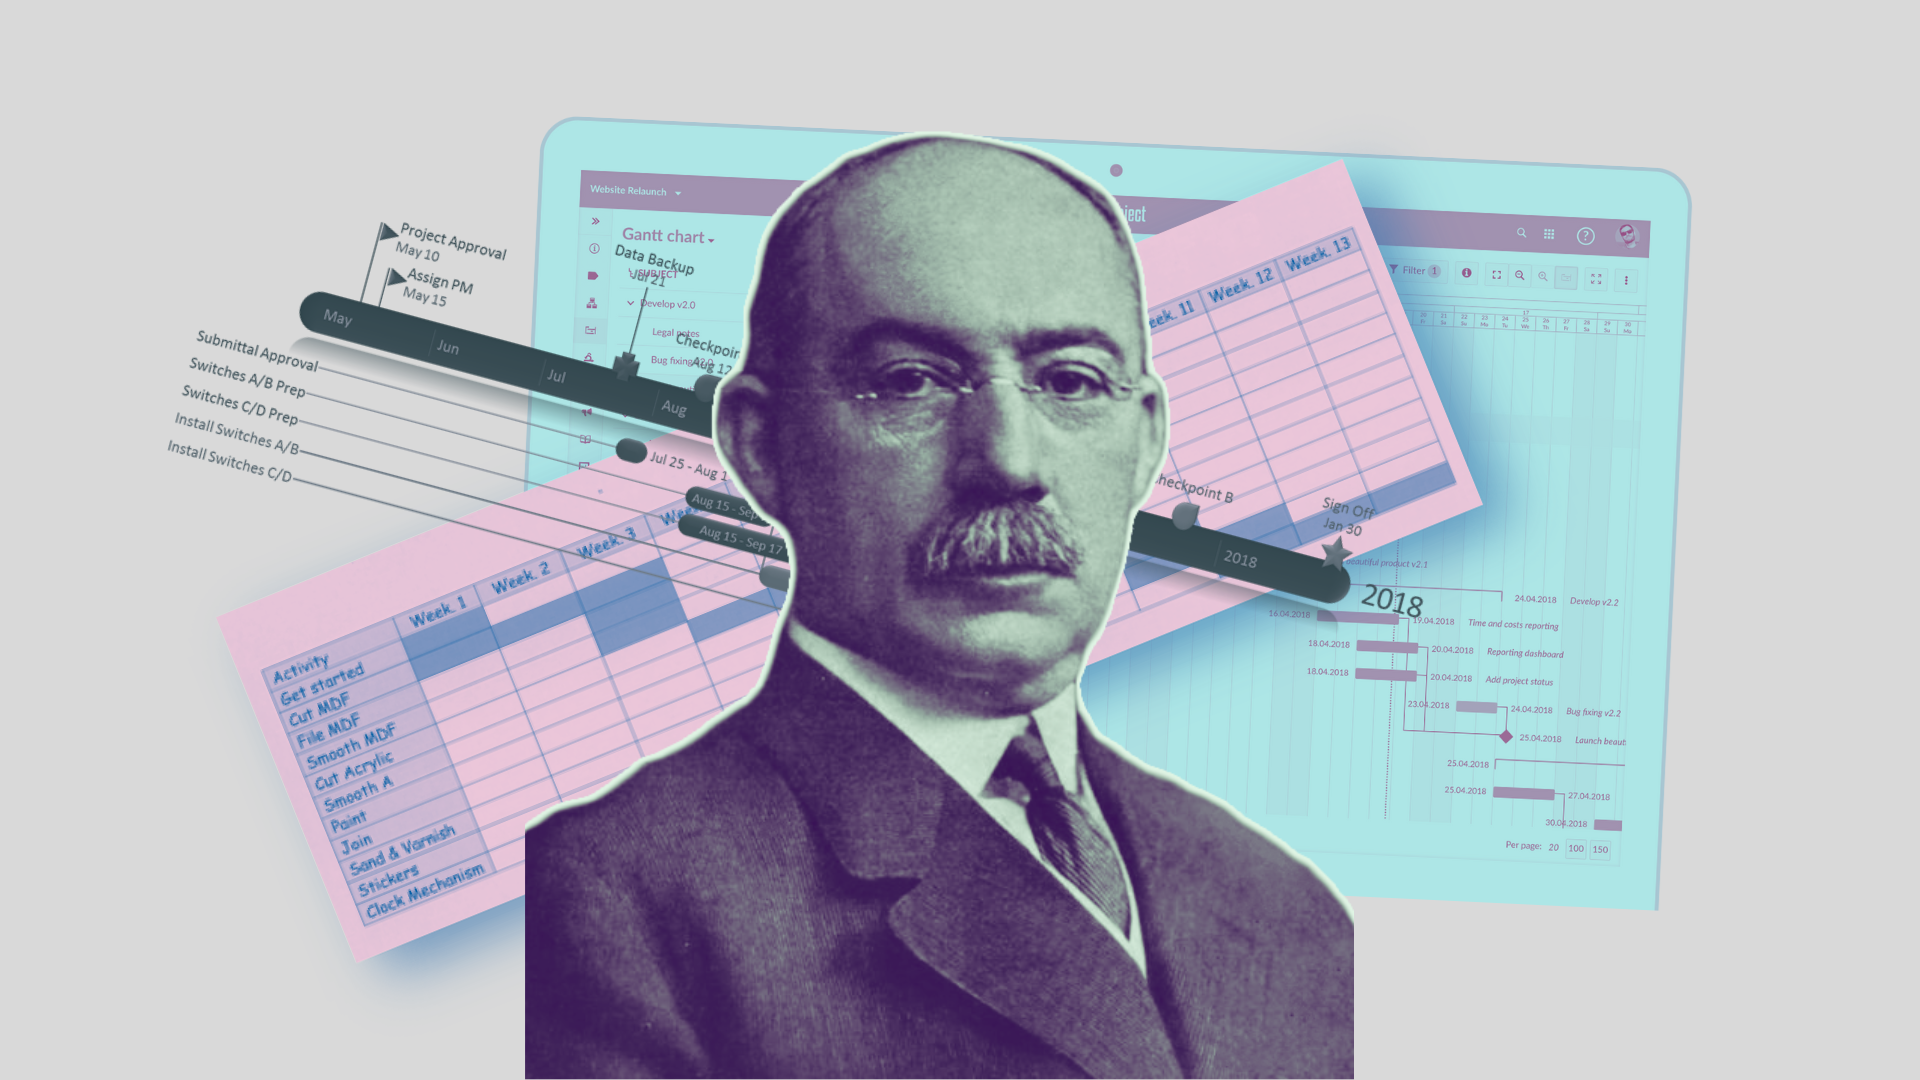
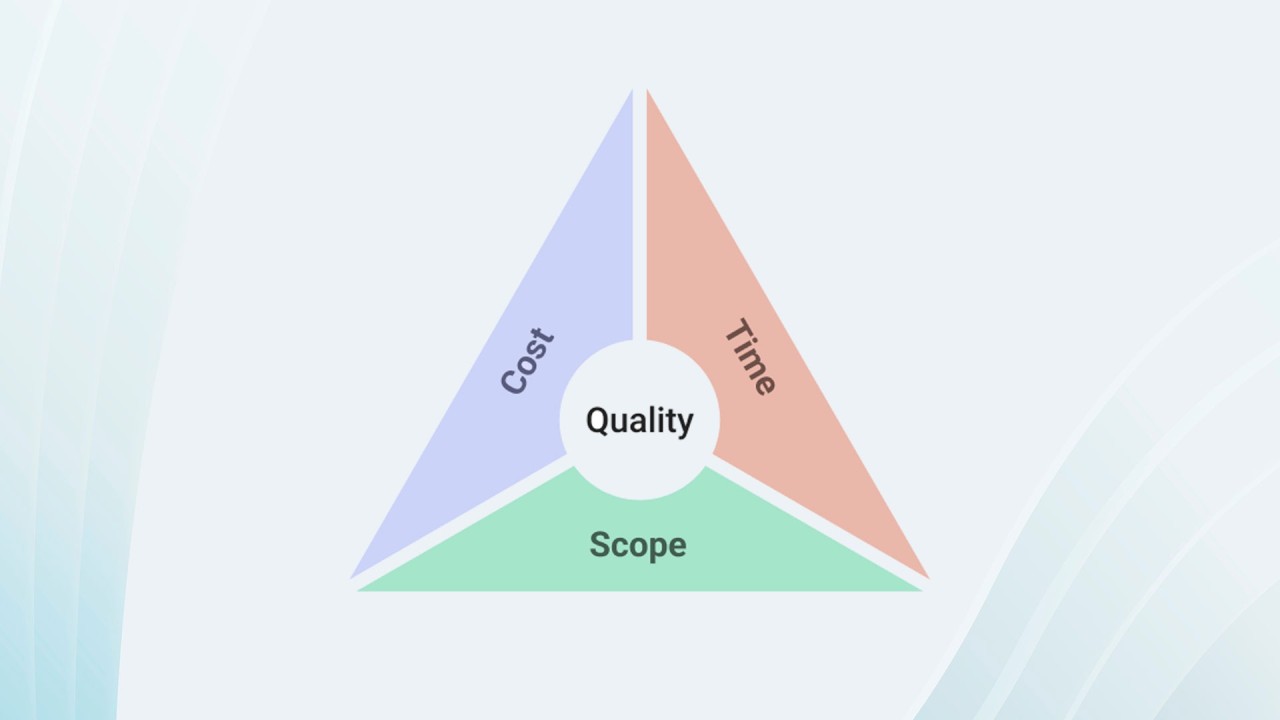
The term ‘iron triangle’ (or ‘triple constraint’) first appeared back in the 1950s and since then it has become one of the most recognizable symbols in project management. Its popularization is related to the fact that it simply and clearly explains the essence of most project conflicts: it is impossible to achieve an ideal result across all parameters simultaneously. The triangle has three sides: timelines, cost and scope (whilst quality is usually represented as the interior of the triangle). Changing one corner affects the other two and the quality — and this is the main idea of the model.
Let’s imagine that the customer wants to speed up the project launch. This means the team has less time for implementation — and will either have to cut the scope of work or increase the budget, for example, by attracting the additional specialists. Or, on the contrary, if the budget is cut, they will have to either reduce the scope or extend the timelines.
Why is the triangle useful?
- It helps to quickly assess where there might be an imbalance. For example, if a team promises ‘everything quickly, cheaply and perfectly’ — that is a reason for concern.
- It simplifies communication with the customer: allowing you to visually demonstrate why it won’t be possible to meet the timelines whilst reducing the costs
- This is an excellent starting point for analysis — especially if you’re just beginning to understand the project constraints.
It is important to emphasize that this is not all-purpose tool. It does not take into account, for example, the risks, involvement of the team, the sponsor, management, stakeholders or external circumstances. In real life, a project may look balanced ‘on paper’ but still fail due to unforeseen factors. It is particularly limited in flexible (agile) projects, where the goals and scope change during the process. Therefore, the triangle is more of a thinking model than an exact calculator.
Below, we will simplify the formulas to make them easier to understand. We also emphasize that the scope, as well as the schedule and price formulas (SPI and CPI), are always compared against the baseline plan approved by the project sponsor and key stakeholders, which must be fixed.
How to measure and control the project scope
Scope (or content) is a list of the tasks and requirements that the project participants must implement. Ideally, it is set out in the project documents, for example, in the Work breakdown structure. Both the timelines and the budget depend on it: the more the functions or works, the longer and more expensive the project becomes. If the team or customer starts adding the tasks without revising the plan, Scope Creep occurs — the project gradually expanding without anyone noticing.
How to measure and control the project timelines
Timelines are the project calendar frames: the start date, end date and duration of the works between them. Time management is one of the key knowledge areas in the Project Management Body of Knowledge (PMBOK), and it is here that the deviations often occur. To seize the opportunity when a project starts to ‘shrink’, the managers are advised to measure progress regularly.
One useful metric in such cases is the Schedule Performance Index (SPI). This Schedule shows the ratio of the Earned value to the Planned value. For operational calculations, a work unit – Work Package – is usually used. For example, in the case of such ‘project’ as moving from the apartment, a unit of work would be ‘packing all the crockery’. Its duration (Planned value) is determined at the planning stage, and during actual execution, the team measures how much time was actually spent.
Equation: SPI = EV/PV. SPI value of less than 1.0 indicates that less work was completed than planned. SPI value of more than 1.0 indicates that more work was completed than planned.
How to measure the project cost
Any work has a price and a final cost – even if it is not money directly, but, say, specialists’ hours or contractors’ services. Cost management is one of the manager’s key tasks, as cost overruns often lead to a project being stopped. The PMBOK uses the Cost Performance Index (CPI) for control. It shows how efficiently the project is spending its funds.
Let’s imagine that in a ‘project’ of moving from one apartment to another, each unit of work is to carry the items up to the fifth floor of a building. The planned cost of the freight handler’s service was 3,500 tenge per hour for 2 heavy items. It was planned that in 3 hours (and 10,500 tenge – Planned value), the freight handlers would move the entire load – let’s say, 6 heavy items.
However, in reality, the work took 5 hours (because of the awkward dimensions of the items), which cost 17,500 tenge (Actual Cost). It turns out that we spent 17,500 tenge (Actual Cost) to ‘earn’ an Earned Value of 10,500 tenge.
The Cost Performance Index is then calculated using the formula:
CPI = EV / AC = 10,500 / 17,500 = 0.6
This means that the project is spending more money on completing one unit of work than it was planned. Such an indicator is a signal to review the terms, contracts or redistribute the tasks before the cost overrun gets out of control.
The iron triangle is a simple model that helps to understand the key interrelationships within a project: between time, money and scope of the tasks. It won’t solve all problems, but it will show where imbalances may arise. This tool can be used to control the changes — the process of managing the changes made to an ongoing project.
For a Junior Project Manager, this is an excellent starting point: if you’ve only just started managing the projects, keep this triangle in mind and learn to spot where it’s starting to fall apart. Further, we’ll take a look at some other models.